mistral.rs v0.9.3: up to 19.5% higher serving throughput than vLLM
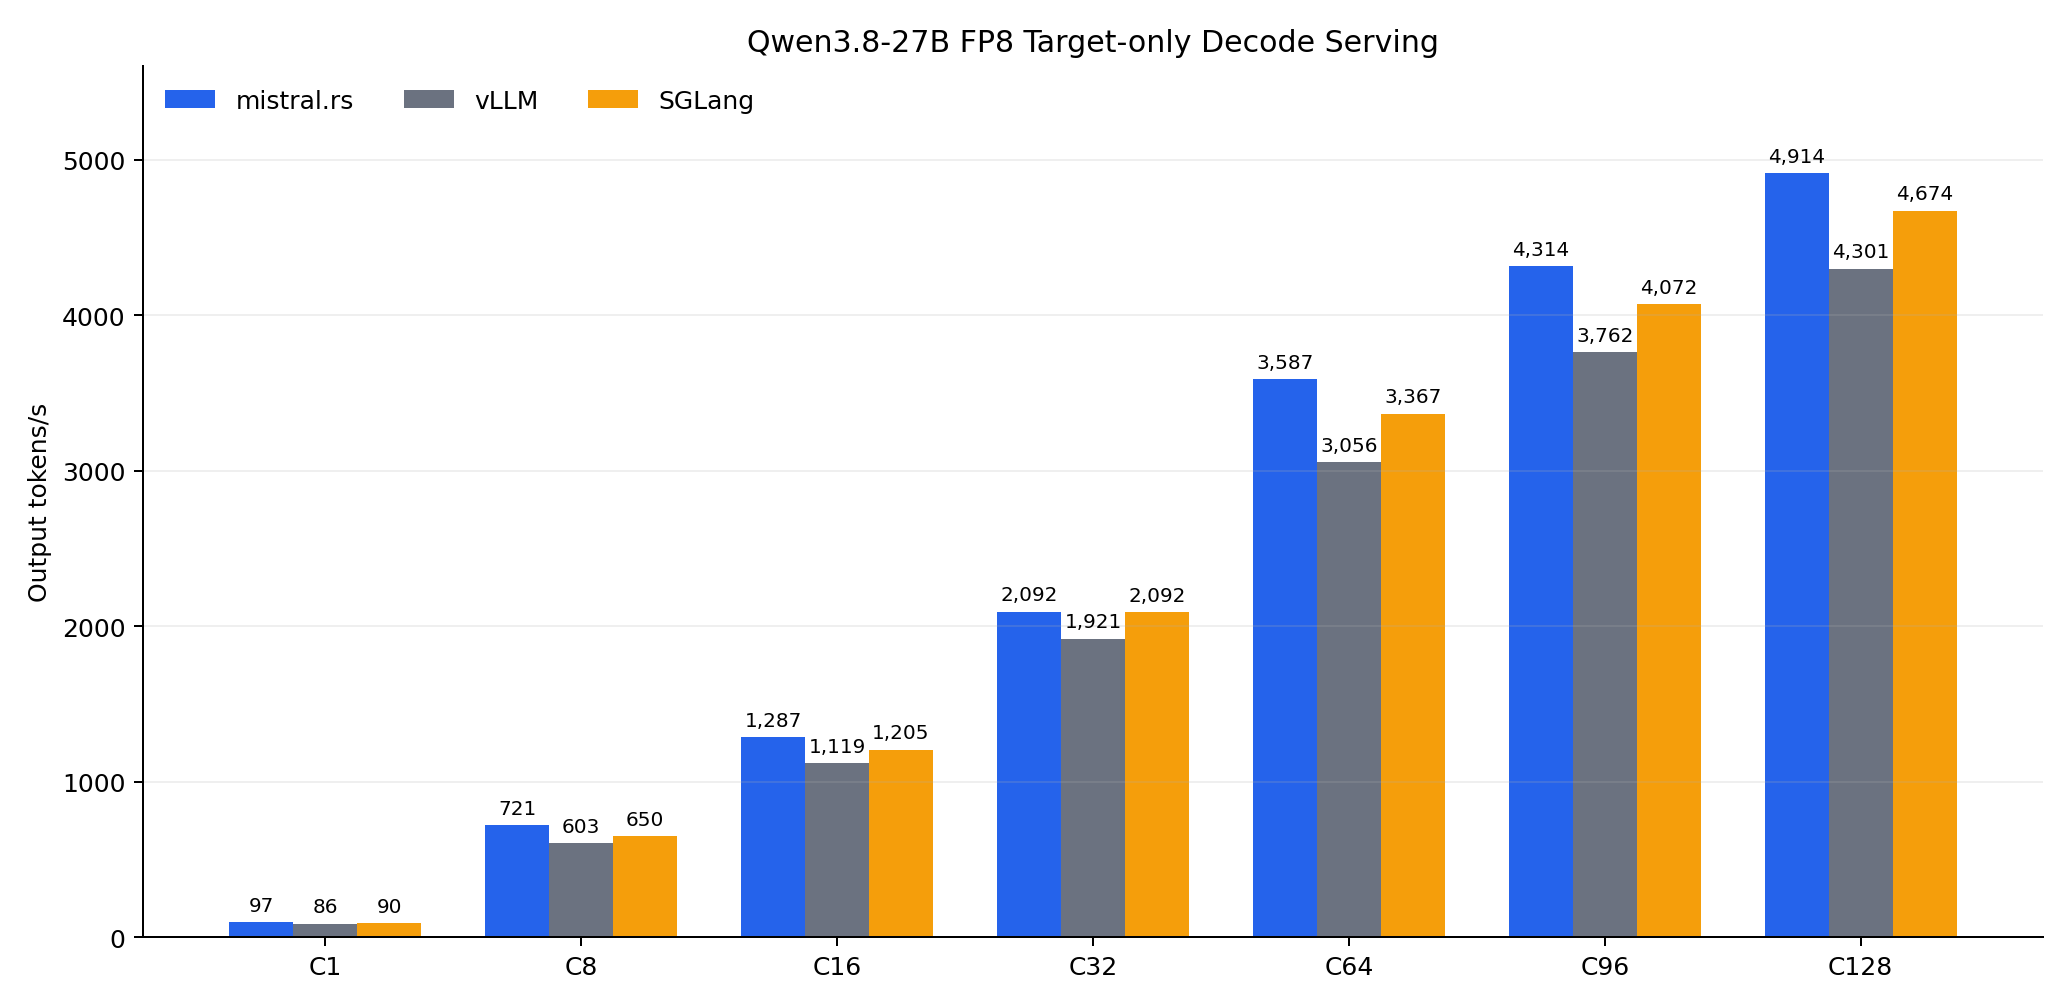
We recently released mistral.rs v0.9.3, focused heavily on CUDA performance and serving throughput. We benchmarked Qwen3.8-27B FP8 against pinned versions of vLLM and SGLang on a single NVIDIA GH200.
The result:
- mistral.rs matched or outperformed both engines at every tested concurrency.
- At C64-C128, it delivered 14.3-17.4% more output throughput than vLLM and 5.1-6.5% more than SGLang.
How we measured it
Everything ran on a single NVIDIA GH200 (aarch64, 96 GB HBM), with no other workloads running on the GPU during measurement.
- Model: Qwen3.8-27B-FP8, with BF16 activations and FP8 E4M3 KV cache.
- Benchmark harness: all benchmarks used vLLM's
bench serveharness. - Sweep: exact client concurrency from C1 to C128.
- Protocol: each cell used a fresh server, one full-concurrency warmup, and three measured repetitions; the tables report the median.
The sampling policy (temperature 1, top-p 0.95, top-k 20, fixed seed, EOS ignored) was identical across engines, and prefix caching was disabled everywhere.
Results
Each measurement is the median of three measured repetitions.
| Concurrency | mistral.rs tok/s | vLLM tok/s | vs vLLM | SGLang tok/s | vs SGLang |
|---|---|---|---|---|---|
| C1 | 96.98 | 86.00 | +12.8% | 89.58 | +8.3% |
| C8 | 721.22 | 603.49 | +19.5% | 650.42 | +10.9% |
| C16 | 1,287.46 | 1,118.76 | +15.1% | 1,204.62 | +6.9% |
| C32 | 2,092.50 | 1,921.11 | +8.9% | 2,091.55 | +0.05% |
| C64 | 3,587.32 | 3,055.66 | +17.4% | 3,367.12 | +6.5% |
| C96 | 4,314.00 | 3,761.59 | +14.7% | 4,072.22 | +5.9% |
| C128 | 4,914.05 | 4,300.76 | +14.3% | 4,673.67 | +5.1% |
Notably, two details stand out:
- Per-token latency: Median TPOT was 9.7-15.5% lower than vLLM at every concurrency, meaning mistral.rs delivered higher throughput while also maintaining lower per-token decode latency.
- Time to first token: At C1, median TTFT was 25 ms for mistral.rs, compared with 134 ms for vLLM and 90 ms for SGLang. It stayed below vLLM through C96 and was within 1% of it at C128.
Full TTFT and TPOT results are available in the report.
DFlash2 widens the gap
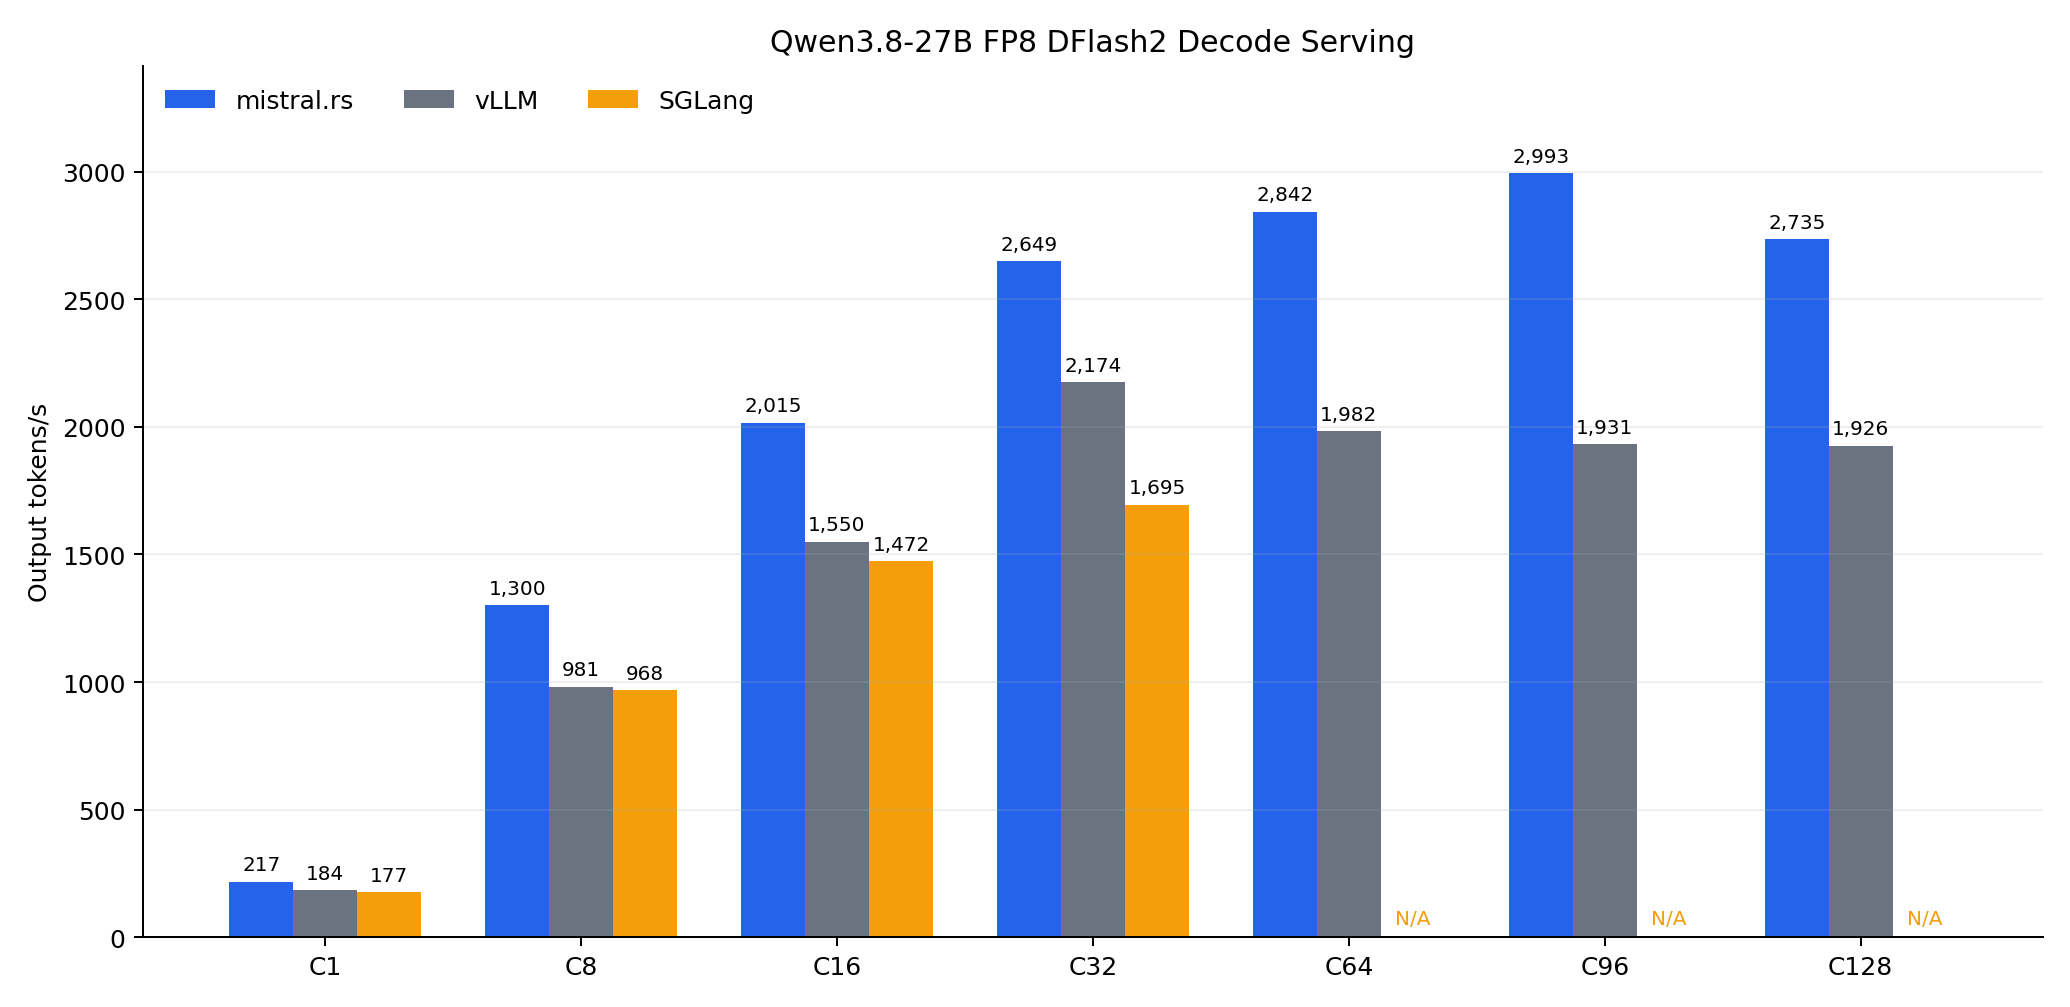
Each measurement is the median of three measured repetitions.
| Concurrency | mistral.rs tok/s | vLLM tok/s | vs vLLM | SGLang tok/s | vs SGLang |
|---|---|---|---|---|---|
| C1 | 216.91 | 184.18 | +17.8% | 176.90 | +22.6% |
| C8 | 1,299.91 | 980.70 | +32.5% | 968.22 | +34.3% |
| C16 | 2,015.46 | 1,550.40 | +30.0% | 1,472.21 | +36.9% |
| C32 | 2,649.16 | 2,173.77 | +21.9% | 1,695.08 | +56.3% |
| C64 | 2,842.22 | 1,982.44 | +43.4% | N/A | N/A |
| C96 | 2,993.44 | 1,931.31 | +55.0% | N/A | N/A |
| C128 | 2,734.89 | 1,925.82 | +42.0% | N/A | N/A |
With DFlash2 speculative decoding enabled, the throughput advantage grew substantially. At C8, C16, and C32, mistral.rs was 32.5%, 30.0%, and 21.9% faster than vLLM, respectively. Against SGLang, the corresponding leads were 34.3%, 36.9%, and 56.3%.
At C64 and above, vLLM's DFlash2 throughput stopped scaling, while mistral.rs remained above 2,700 output tok/s, widening the measured lead to 42-55%. SGLang's DFlash2 serving failed to run at C64 and above under the matched configuration. See the full report for configuration details and the complete results.
Reproducing these results
To ensure a fair comparison, we recorded all versions and include detailed instructions in the report.
Read more: releases/v0.9.3/report.md.